My most Google'd R code.
R tips and tricks
Table of Contents
Rmarkdown
Default YAML header
---
title: 'TITLE'
subtitle: 'SUBTITLE'
author: "Kim Dill-McFarland, kadm@uw.edu"
date: "version `r format(Sys.time(), '%B %d, %Y')`"
output:
  html_document:
    toc: yes
    toc_depth: 4
    toc_float:
      collapsed: no
editor_options:
  chunk_output_type: console
always_allow_html: true
fig_width: 8.5
---
ggplot
Color
Emulate ggplot scales::hue_pal()(4)
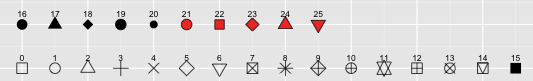
Shape
Axes
Rotate theme(axis.text.x = element_text(angle = 45, hjust = 1))
Reorder ggplot(aes(x=reorder(x.var, y.var), y=y.var))
Log scale scale_y_log10()
Remove all labels
theme(axis.title.x=element_blank(),
      axis.text.x=element_blank(),
      axis.ticks.x=element_blank())
Facets
Relabel facets
facet_grid(~ varaible, labeller = as_labeller(c( "orig1" = "new1", "orig2 = "new2")))
Special characters
'italic("In vivo")~"TEXT"*alpha'
facet_wrap(~facet.lab, labeller = label_parsed)
Statistics
Add summary statistic stat_summary(fun="mean", geom="crossbar")
Add P-value stat_compare_means(method="wilcox.test")
Specific plot types
Label all points
geom_text_repel(aes(label = rowname), direction = "both",
                nudge_x = -0.4, min.segment.length = unit(0, 'lines'),
                show.legend = FALSE, max.overlaps = 100)
Barplot up to 100%
geom_bar(position = "fill", stat = "identity")
Side-by-side barplot
geom_bar(stat = "identity", position = 'dodge')
Connect jittered points
geom_line(aes(group = pair), position = position_dodge(0.2)) +
geom_point(aes(group = pair), position = position_dodge(0.2)) +
Tables
Manipulation
List to data frame
plyr::ldply(l, data.frame)
kableExtra
Standard table format
kable() %>%
kable_styling(bootstrap_options = "striped", full_width = FALSE)
Format column
column_spec(1, bold = TRUE, background = "yellow", border_right = TRUE)

add_header_above(c(" ", "Group 1" = 2, "Group 2" = 2, "Group 3" = 2))
Row format
row_spec(1, bold = TRUE, background = "yellow")

pack_rows("Group 1", 4, 7)
Format cell
dat$col <- cell_spec(dat$col, color = ifelse(dat$col <= 0.05, "red", "black"))

kable(escape = FALSE) %>%
kable_styling(bootstrap_options = "striped")
More from From Hao Zhu
Symbols and math
Greek letters \alpha
Arrow \to
Sub/superscript k_sub^super
Fraction \frac{numerator}{denominator}
Plus/minus \pm
More from Archer Reilly